Note
Go to the end to download the full example code
Tutorial 0.0: Hello World
The first steps
Imports
pyb2d is imported as b2d
import b2d
import numpy as np
These imports are only needed for plotting. b2d.plot requires OpenCV to be installed!
import b2d.plot
import matplotlib.pyplot as plt
The first step with Box2D is the creation of the world. The world is parametrized by a gravity vector.
# the world
gravity = (0, -10)
world = b2d.World(gravity)
Create a circle-shaped body
# the body def
body_def = b2d.BodyDef()
body_def.type = b2d.BodyType.dynamic
body_def.position = (0, 0)

# the body
body = world.create_body(body_def)

# shape
circle_shape = b2d.CircleShape()
circle_shape.radius = 1.0

# the fixture
fixture_def = b2d.FixtureDef()
fixture_def.shape = circle_shape
fixture_def.density = 1.0

# create and add the fixture to the body
fixture = body.create_fixture(fixture_def)
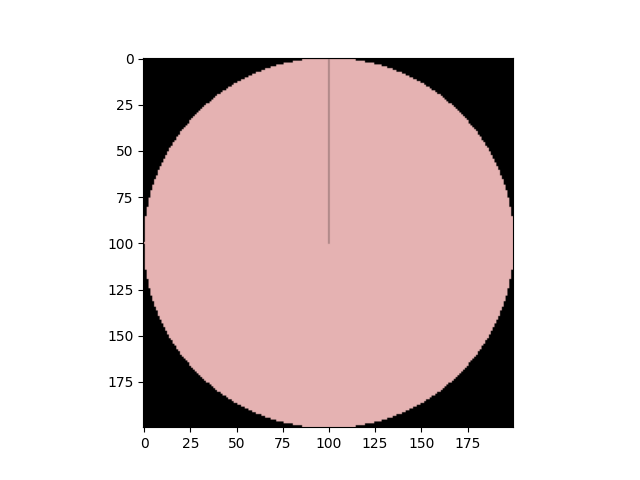
We can now have a look at the world: We render the world st. each meter in the Box2D world will be 100 pixels in the image:
pixels_per_meter = 100
b2d.plot.plot_world(world, ppm=pixels_per_meter)
plt.show()
Lets run the world for a total of 5 seconds. Usually one wants to run the world at a certain frame rate. With the frame rate and the total time we can compute the delta for each iteration and how many steps we need
t = 5
fps = 40
dt = 1.0 / fps
n_steps = int(t / dt + 0.5)
print(f"t={t} fps={fps} dt={dt} n_steps={n_steps}")
t=5 fps=40 dt=0.025 n_steps=200
in each step we query the bodies position and velocity and store then for later plotting
positions = np.zeros([n_steps, 2])
velocites = np.zeros([n_steps, 2])
timepoints = np.zeros([n_steps])
do it
t_elapsed = 0.0
for i in range(n_steps):

    # get the bodies center of mass
    positions[i, :] = body.world_center

    # get the bodies velocity
    velocites[i, :] = body.linear_velocity

    timepoints[i] = t_elapsed

    world.step(time_step=dt, velocity_iterations=1, position_iterations=1)
    t_elapsed += dt
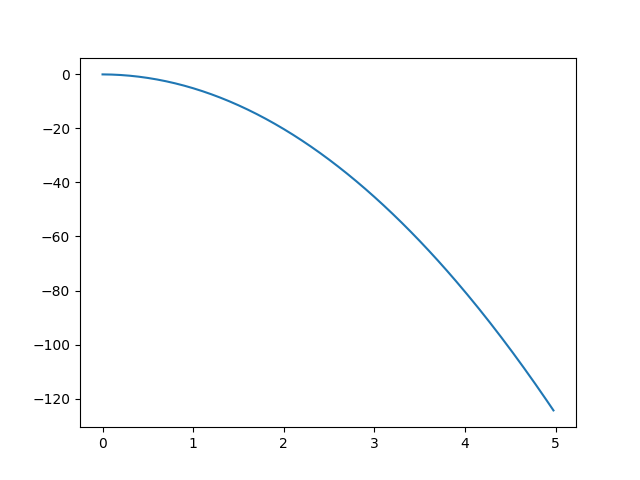
plot the y-position against the time. We can see that the body is falling down in an accelerating way:
plt.plot(timepoints, positions[:, 1])
plt.show()
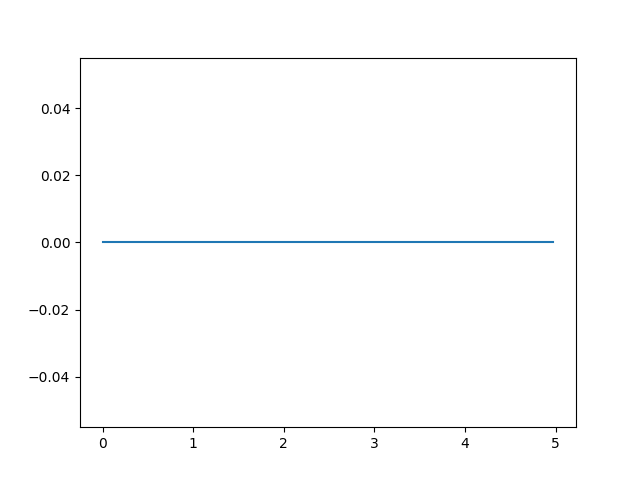
as expected the x position is not changing since the gravity vector is non-zero only in the x direction
plt.plot(timepoints, positions[:, 0])
plt.show()
Total running time of the script: ( 0 minutes 0.213 seconds)